No doubt the entire world is going to be raving about this over the next few days. Google (you don’t really need a link, do you?) have released the beta of their new Analytics service which tracks visitor usage of a website. And it’s fantastic, just incredible.
Now, the amount and breadth of data that Google Analytics collects has always been very impressive, even if they have been a bit tight-fisted over it. (Did you know you would break their terms of service if you ran a report showing individual IP addresses visiting your website? It’s personally-identifiable information, a big no-no.) However I’ve always felt the reports shown were a bit hit and miss. That has all changed.
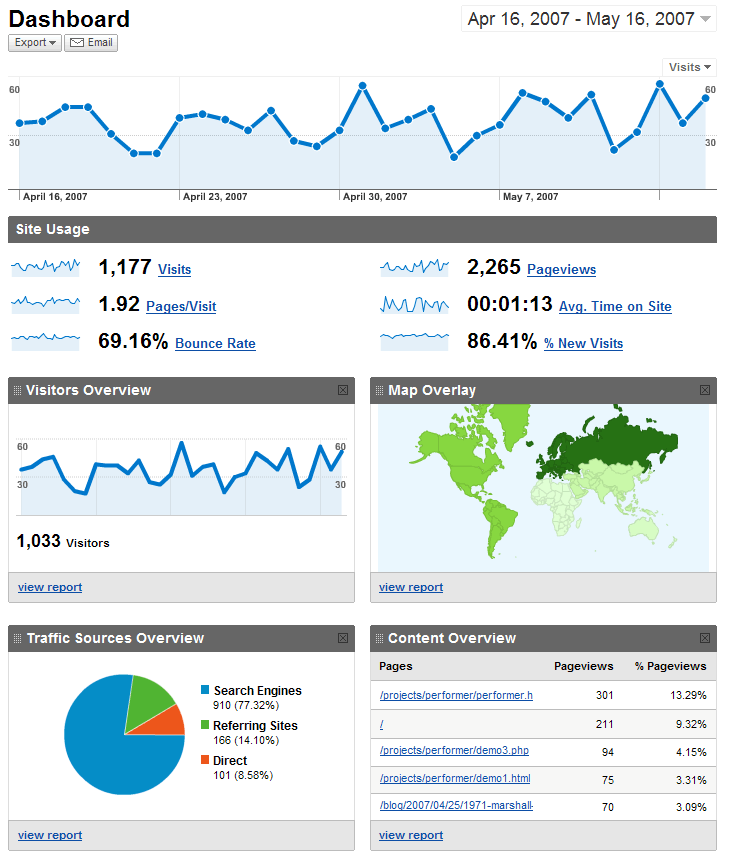
This is a quick screenshot of the Analytics dashboard for this very site, don’t laugh at the numbers too much 🙂
Every report now has the main bit of information you want to see – the number of visitors – in a handy graph at the top of the page. Then there are areas below that showing specific data, with plenty of use of sparklines. The reports themselves have been split into Visitors, Traffic Sources, Content and Goals – much better than the old webmaster/marketer malarkey.
Below that the individual reports seem to be fairly in line with the old system, but polished up a lot of course. There’s still the “site overlay” report, which now shows you your actual site with a Google Analytics toolbar over the top, and little graphs to show how many people clicked each link. Classy. The map overlay report allowys you to drill down from the entire world to individual continents, then sections of continents (North Europe, for example) then countries. That’s a massive step forward from the old way of having to zoom into the Flash map to see any kind of details. Well done Google.
But the bit that’s impressed me most so far is the PDF export. The exported reports are fantastic, just beautiful, and perfect for sending to managers who like looking at graphs. The attention to detail is impressive, too. For instance, their sparklines (both on the web page and in the exported PDF) aren’t just squiggly lines, they have subtle shading underneath. Special.
All in all this is a fantastic upgrade, and makes it an even more difficult choice when selecting a site statistics package. Basically the choice is:
- Google Analytics
- Pros: free, easy to implement, few technical requirements, fantastic.
- Cons: All your data is held by one of the worlds biggest corporations.
- Mint
- Pros: beautiful, ever-increasing collection of plugins, you hold your own data
- Cons: cost (very cheap costs, but it still costs something), technical requirements (database, some configuration)